Fields
action
3
agent
22
asyncToken
327
authUser
23
awsRegion
3
bytes
2716
loremIpsum
1
close
Estimated values for action
Analyze
table_chartGroup
Graph
show_chartTimeseries
bar_chartBar
pie_chartPie
show_chartTimeSeries
pie_chartPie Chart
6,701,243 matching events (5 minutes / bar)
show_chartExpand Graph
5:55 - 8:55 pm [UTC-1]
first_page
last_page
more_vert
Show Tabs
first_page
last_page
Nov 4 12:37:10.049
prod-api-33
accountID
=
'AAAAAF1iqdc9dogq'
accountEmail
=
'sinskeep@npr.org'
agent
=
'Mozilla/5.0 (Macintosh; Intel Mac OS X 10.15;
rv:95.0) Gecko/20100101 Firefox/95.0'
credentialPermission
=
'fullAccess'
action
=
'download'
result
=
'success'
sha256
=
'ba7816bf8f01cfea414140de5dae2223b00361a396177a9cb410ff61f20015ad'
size
=
'1231'
Events Unavailable
Sorry, we're unable to display events when the query includes commands that transform the event set, such innerJoin and filter
First 1000 rows shown. Show all
No results
Add Commands to transform and summarize event data. Learn more
Learn More
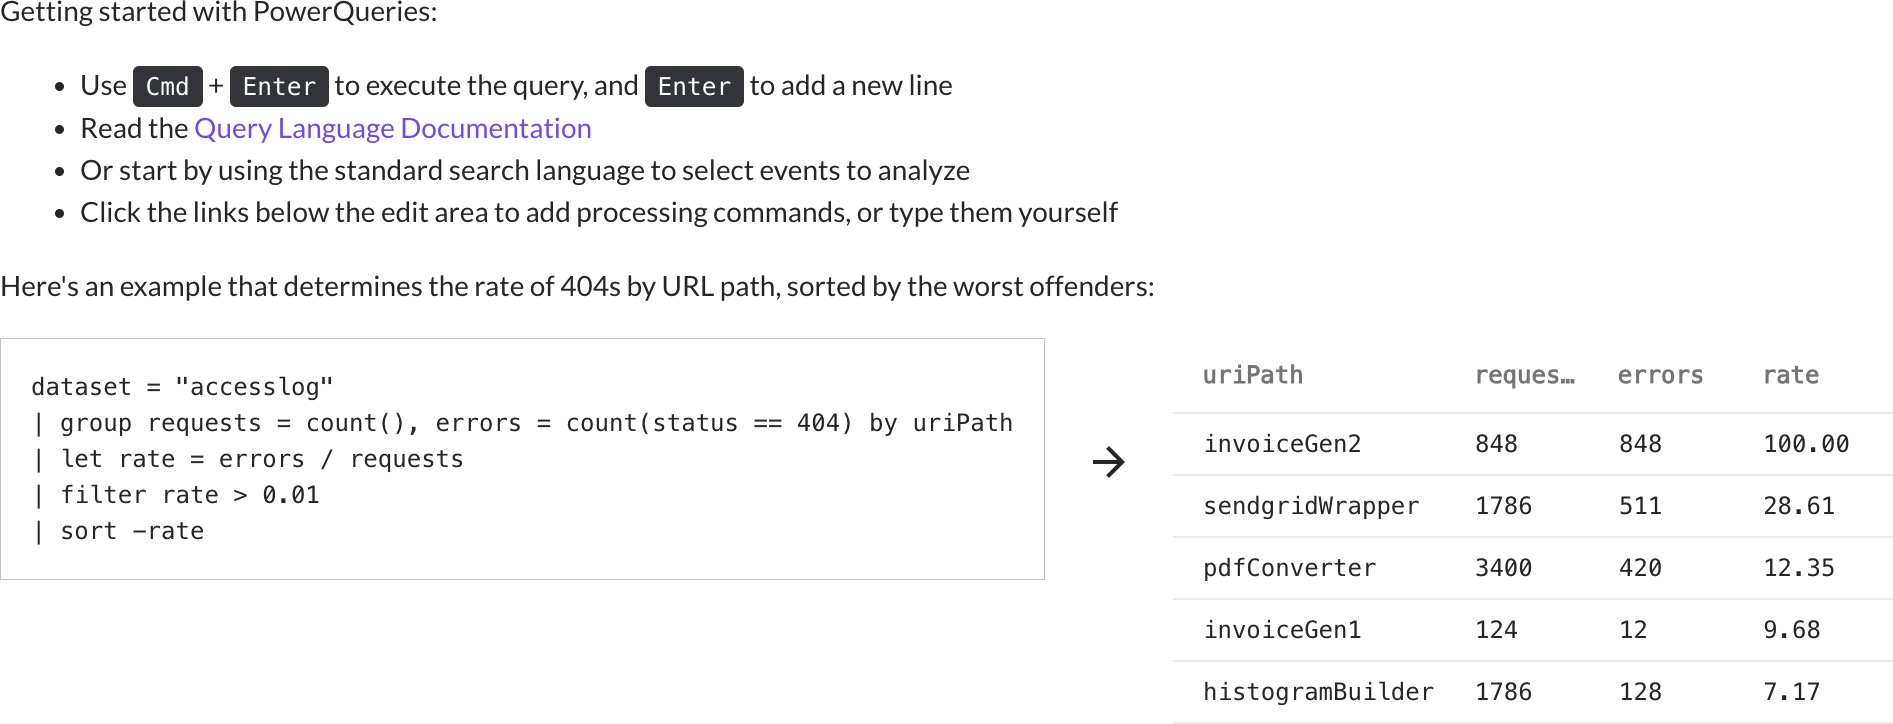
dataset = "accesslog"
| group requests = count(),
  errors = count(status == 404) by uriPath
| let rate = errors / requests
| filter rate > 0.01
| sort -rate
east
| uriPath | requests | errors | rate |
|---|---|---|---|
| invoiceGen2 | 848 | 848 | 100.00 |
| sendgridWrapper | 1786 | 511 | 28.61 |
| pdfConverter | 3400 | 420 | 12.35 |
| invoiceGen1 | 124 | 12 | 9.68 |
| histogramBuilder | 1786 | 128 | 7.17 |
3 rows returned
5:55 - 8:55 pm [UTC-1]
| action more_vert | count() more_vert |
|---|---|
| edit | 206,890 |
| download | 158,372 |
| share | 10,283 |
12 rows returned
5:55 - 8:55 pm [UTC-1]
| timestamp more_vert | action more_vert | count() more_vert |
|---|---|---|
| Feb 8 · 2:00:00.000 am | edit | 1303 |
| Feb 8 · 2:00:00.000 am | download | 2715 |
| Feb 8 · 2:00:00.000 am | share | 828 |
| Feb 8 · 3:00:00.000 am | edit | 278 |
| Feb 8 · 3:00:00.000 am | download | 199 |
| Feb 8 · 3:00:00.000 am | share | 372 |
| Feb 8 · 4:00:00.000 am | edit | 391 |
| Feb 8 · 4:00:00.000 am | download | 276 |
| Feb 8 · 4:00:00.000 am | share | 281 |
| Feb 8 · 5:00:00.000 am | edit | 374 |
| Feb 8 · 5:00:00.000 am | download | 219 |
| Feb 8 · 5:00:00.000 am | share | 229 |
6 rows returned
5:55 - 8:55 pm [UTC-1]
| size more_vert | mean(MBps) more_vert | p5(MBps) more_vert | max(MBps) more_vert |
|---|---|---|---|
| 00-01 MB | 2.47 | 0.339 | 45.9 |
| 01-10 MB | 53.97 | 57.611 | 96.8 |
| 10-20 MB | 70.79 | 73.510 | 99.2 |
| 20-50 MB | 76.87 | 73.510 | 99.2 |
| 50-99 MB | 82.45 | 84.979 | 99.4 |
| 99+ MB | 98.71 | 97.017 | 110.5 |
Visualize Results as...
show_chart
Timeseries
bar_chart
Bar/Column Chart
pie_chart
Pie Chart
pie_chart
Pie Chart
Choose...
Go
Graph of Matching
Events/Sec broken down by action
5:50 AM - 9:50 AM [UTC-8]
fast_rewind
fast_forward
show_chart
bar_chart
pie_chart
(time)
check
Functions
check
Average
2.12M
check
Compare To
check
Prev hour
check
Prev 4 hours
check
Prev day
2.12M
check
Prev week
check
Prev 2 weeks
check
Delta
check
action
check
edit
2.12M
check
download
2.86M
check
share
.03M
check
size
check
00-01 MB
2.12M
check
01-10 MB
2.86M
check
10-20 MB
.03M
check
20-50 MB
.03M
check
50-99 MB
.03M
check
99+ MB
.03M
Pie Chart
Sections
keyboard_arrow_down
(Or user could choose group over here)
Group by Action x
check
Idle
check
Blocked
check
Alerts
Settings
keyboard_arrow_down
(Content TBD)
